Using the IR
Using the IR
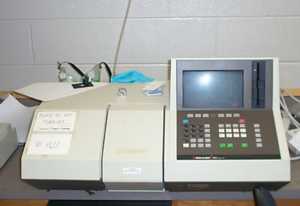
The Perkin Elmer 1600 is a Fourier Transform IR. The lab has both liquid cells for pure liquid and solution samples, and KBr presses for solid samples.
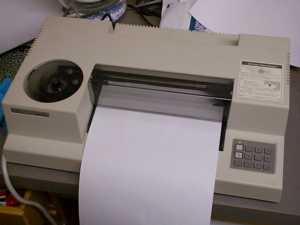
The samples are placed on the left-hand side of the sample compartment (as shown below). The KBr pellet press is held in place by a black plastic sample holder. The liquid cell slides right in the slot on the side.
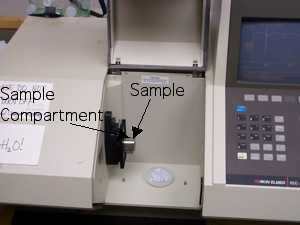
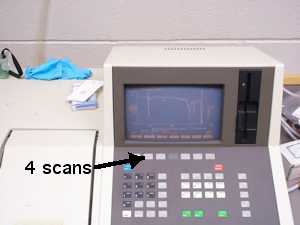
Before scanning a sample, a background scan must be taken. Place the empty pellet press or the liquid cell with the solvent (only) in the sample chamber. Close the sample chamber door. Press the <Scan> button followed by the <Backg> (background button). On the bottom of the screen, there will be several different numbers of scans for you to choose. Press the button under the number 4. Wait until all 4 scans have completed before removing the sample.
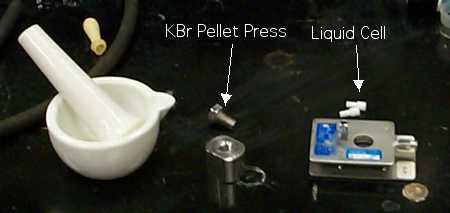
To prepare a KBr pellet, obtain some KBr powder from the oven in the organic lab. Grind some (200 mg or so) of KBr and a small amount of your sample with a mortar and pestle. Put one bolt in the pellet press and cover the bolt with a ~3 mm layer of sample.
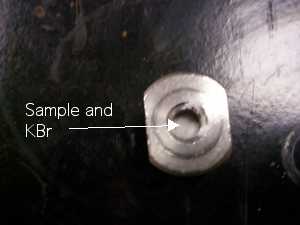
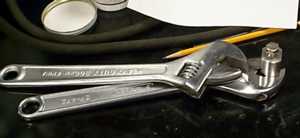
Place the second bolt in the press and tighten well (50 lb-ft) with wrenches. Allow the sample to sit for 30 seconds and open the press. Place the sample in the spectrometer.
To prepare a solution sample, drop the solution with the sample into the cell, then place the teflon plugs in the holes. Place the sample in the spectrometer.
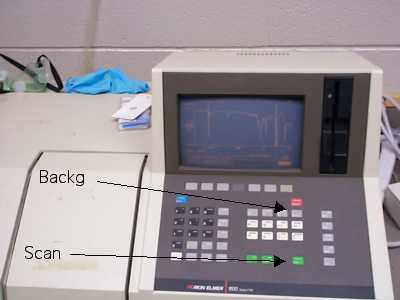
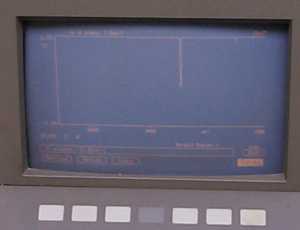
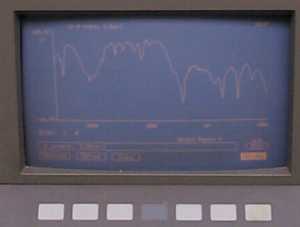
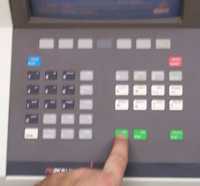
To scan the sample, Press the <Scan> button and the button under the number 4 (as with the background). After the scanning is complete, you will need to use the up, down, expand, and contract keys on the keyboard to bring the spectrum into view on the screen. Before doing this, very little (or none) of the spectrum will likely be on the screen (as below).
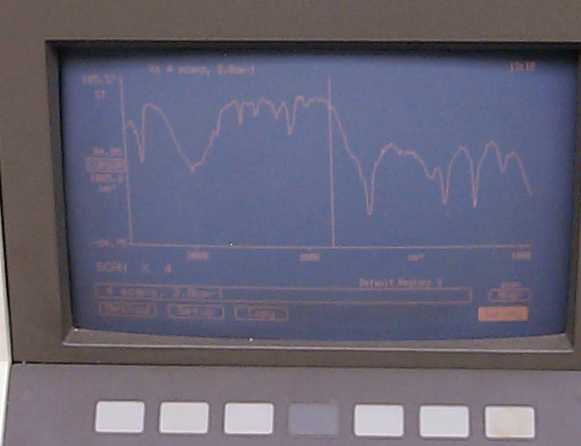
After adjustment, the range of interest should be on the screen (as below).
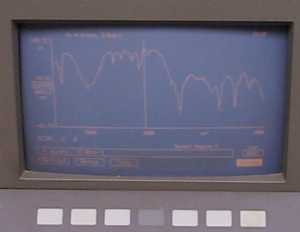
Next, the relevant peaks need to be marked. Press the <Shift> button and then the <V Cursor> button. This should put a vertical line on the screen.
Use the arrow keys to place the cursor over a peak, then press the <Shift> key followed by the <Mark> key. A small dash will be placed on the peak. Repeat for each peak of interest in the spectrum.
To print the spectrum, place a piece of paper up to the white line on the pen plotter (under the rollers). Then push the roller button and allow the machine to load the paper.
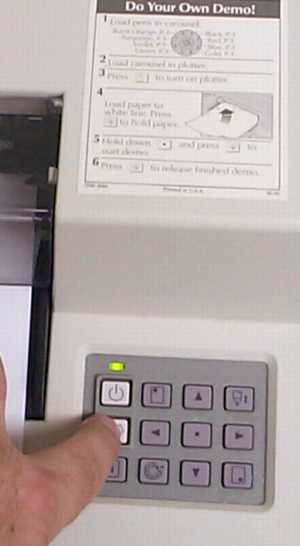
Press the <Plot> button. The spectrum should now plot on the plotter.
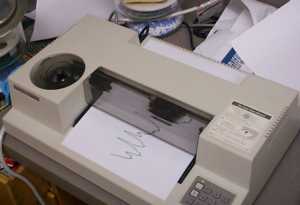
When the spectrum has finished printing, press the roller button again to release the paper.
This tutorial was created by Michael R. Jordan at Oklahoma Baptist University. Reproduction by printing or photocopying for instructional use by educational institutions is allowed.